Month: July 2022
Critical Path Analysis: How to Ensure Transparency in Software Development with Your Vendor
Software development has already become something that almost every business needs and eventually does to increase revenue, attract new customers and optimize their internal processes. Despite the fact that countless businesses have already gone through the software development process, projects continue to fail at a high rate.
Surveys from Gartner, The Project Management Institute, McKinsey, Geneca, and other organizations show that the failure rate of projects fluctuates between 25-85%. Software development projects are even harder to manage, yet, only 58% of organizations fully understand the value of project management according to PMI. Only 23% of organizations use standardized PM practices in all of their processes.
As you can see, the importance of project management is extremely high despite being systematically underestimated.
In this article, we’ll talk about one of the ways you can significantly reduce the risk of failure for your software development project, as well as increase the transparency with your vendor and improve your planning efforts. All of this can be achieved by using critical path analysis while creating a technology roadmap for your project.
I’ll demonstrate the logic of this method by providing you with a critical path analysis example.
What is Critical Path Analysis?
Critical path analysis is a method in project management and roadmap planning that creates a path of all actions necessary to complete the project. This method allows project managers to prioritize all actions that are absolutely critical to the project, and determine their optimal sequence.
Critical path analysis or CPM in software project management is focused on finding dependencies between tasks and set realistic deadlines for them. Timeline is one of the most important factors in this method. Most software development projects eventually break their deadlines, and critical path analysis was created to help project managers and stakeholders to build software on time.
What is a critical path method? It is the longest chain of tasks that needs to be completed for the timely delivery of a project. Any delays in completing these tasks will affect the whole project, that’s why the chain of these tasks is called critical.
This method was first introduced at the end of the 50-s to solve issues caused by inefficient planning. Since then this method has evolved and become popular in software development, as it allows managers to divide a large project into small tasks and make the development process more flexible.
Why you need Critical Path Analysis in your project
Let’s talk about the benefits of critical path analysis for your software development project.
Future project planning. Critical path analysis not only allows you to plan your project but also compares how your plan actually works in reality. This comparison will help you plan your future projects, as you’ll know how something may turn out in real project development conditions.
Better resource allocation. The critical path method allows project managers to prioritize tasks and thus better allocate their resources, knowing where they’re needed the most.
Effective risk estimation and avoiding obstacles. Critical path analysis allows you to see the potential bottlenecks in your project and help you avoid any obstacles before they become issues. With CPA you also know how much time you’ll have to resolve each issue without disrupting the whole project.
How to find a Critical Path for your software development project
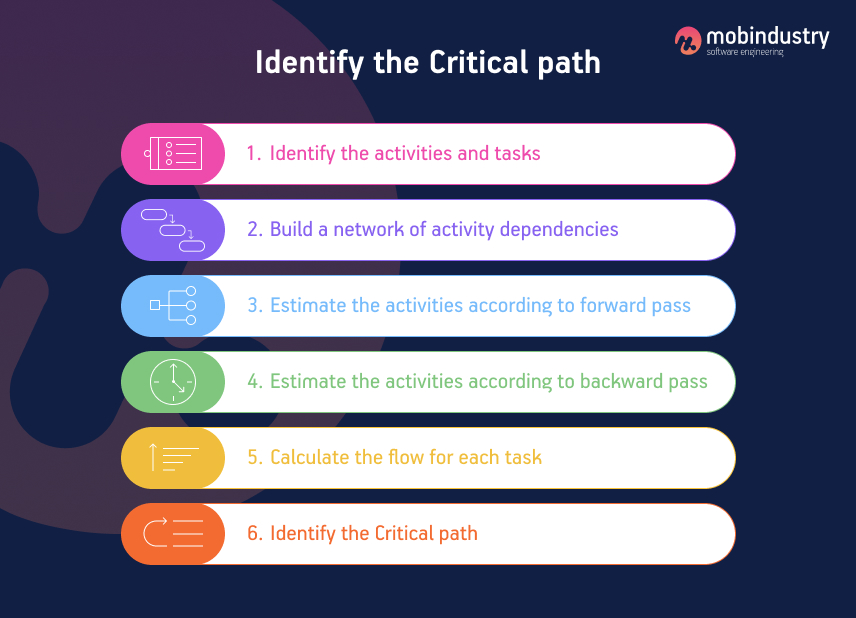
To find a critical path in your project, you need to do these four major steps:
- Identify the activities
- Build a network of dependencies between the activities
- Estimate all activities according to the forward and backward pass
- Identify the critical path
Let’s discuss each step in detail.
Step 1. Identifying the activities
First thing you need to do is decompose your project into separate activities. The network of activities will be a basis for your analysis. Let me demonstrate this on a very simplified example.
Let’s start with some critical path analysis examples. Say, you’re planning to build an application. Here are some tasks you need to complete in order to reach your goal:
| Task ID | Predecessor | Duration (in weeks) |
| A | – | 2 |
| B | A | 0.5 |
| C | A | 1 |
| D | C | 6 |
| E | A | 2 |
| F | E | 2 |
| G | D | 1 |
| H |
This is of course an extremely simplified process, and any task in this list can be divided into dozens of its own tasks with more precise estimates. Your vendor has gone through this process countless times, so they’ll be able to identify all tasks necessary to complete the project.
After the tasks are identified, it’s time to create a network of their dependencies. I’ve done this partly in the table above by stating the predecessors of each task. A predecessor is a task that you need to complete before the next task. Without this, the next task won’t be possible to do.
Step 2. Building a network of activity dependencies
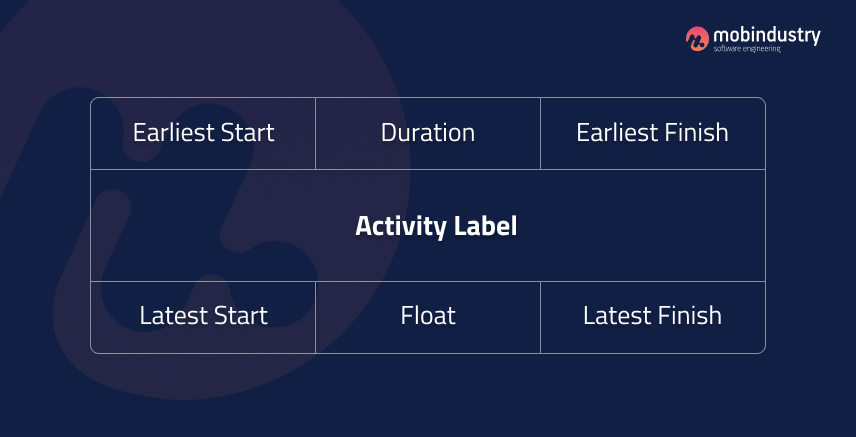
Some activities depend on successful completion of other tasks before them, so it’s important to define these relations in a network of dependencies. Create a network and assign nodes to it. Nodes should include:
- A task ID — you can see it in the table above
- Earliest start — a date at which you can start working on a task the earliest
- Duration — a time it will take to complete a task
- Earliest finish — earliest estimated date of task completion
- Latest start — latest date when you can start working on a task
- Float — the difference between latest and earliest start as well as latest and earliest finish. Basically it’s the time you can afford to lose without disrupting the whole timeline of the project
- Latest finish — the date of when the task can be finished the latest
This is how a node should look like:
Build a network of activities assigning each task a set of nodes mentioned above. Thus you’ll have a big picture in front of you. Here are the rules for building a Node-based network diagram:
- A project should only have one star and one end node
- Each node needs to have a duration
- Links don’t need to have a duration
- Predecessors are the immediate preceding tasks
- No loops and dangles are allowed in the network
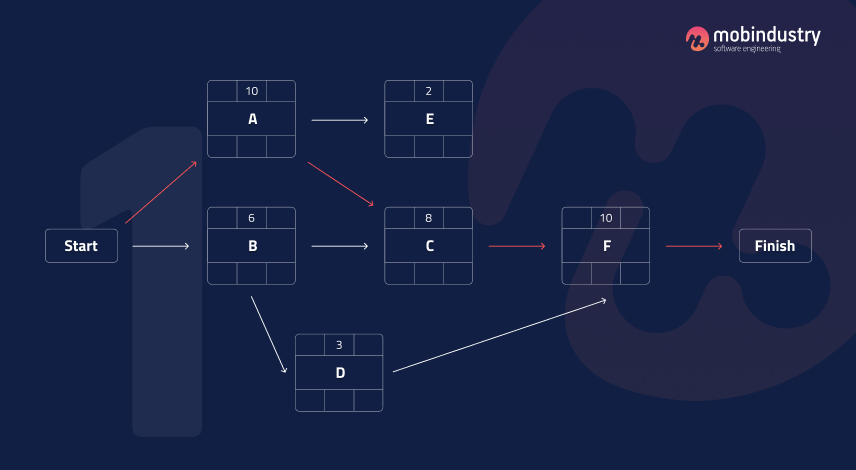
You can create this table manually or use special critical path method software to automate this process. Here are some examples of critical path analysis tools:
- nTask
- Zoho Projects
- Wrike
- LiquidPlanner
- Lucidchart
Step 3: Estimating all activities according to the forward and backward pass
Now it’s time to fill in all the nodes using the earliest and latest start and finish dates. To do this, you’ll need to consider all the dependencies between the tasks. For example, if you plan to start task A on May 12 at the earliest, then it will be finished on May 26. Task B, which goes right after task A, will be started on May 27.
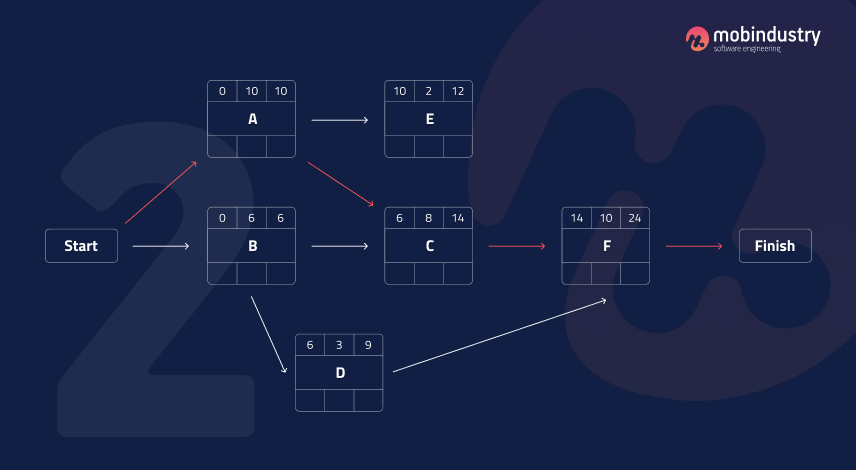
Using these sequences, you need to build the whole timeline that will contain the earliest dates for each task to start and finish.
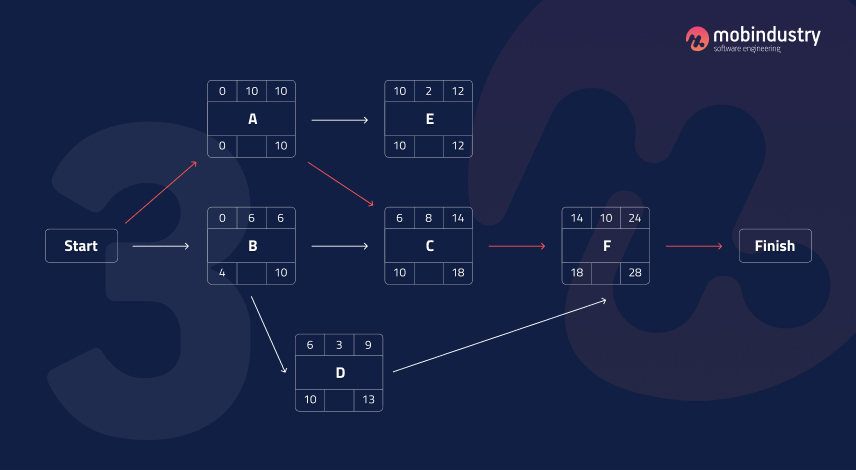
The backward pass is carried out in a similar manner, but now you’ll consider the latest dates for each task.
Step 4. Calculating float for each task
The float shows the time you have for each task. It shows how long you can delay the task without it affecting other tasks or the delivery date. Calculating the float of each task allows you to assess the flexibility of your whole project. This resource will allow you to cover all risks and have time to resolve all the unpredictable issues on your project.
The most important tasks have no float, and those that have positive float are non-critical, so you can postpone them without harming the project’s timeline. If you don’t have enough time and resources, you can even miss some of the non-critical tasks and put them in the backlog.
There are two types of float: free and general float.
- Free float is the time you can postpone your task without it affecting the subsequent task. Free float = ES (of the next task) – EF (of the current task)
- General float is the time you can postpone your task without it affecting the delivery time of the whole project. General float is calculated according to this formula: LS – ES or LF – EF.
Why is it important to calculate the float of your project? Here are some reasons:
- Knowing the float of each task allows you to plan your projects more effectively and make sure each task is completed on time. The more float you have, the bigger is the chance to deliver your project on time or even earlier than planned
- The float allows you to prioritize tasks: you can see which tasks have the most float and know exactly for how long you can postpone them
- Float allows you to cover risks and resolve issues that arise during the development. No matter how well you planned the project, unexpected issues will always appear, and it’s important to have time to resolve them.
Step 5. Identifying the Critical path
The critical path shows you the earliest time the whole project can be completed based on a sequence of tasks that influence the project the most. In order to find a critical path, you need to calculate the float of each activity: the time between the earliest and latest start and finish.
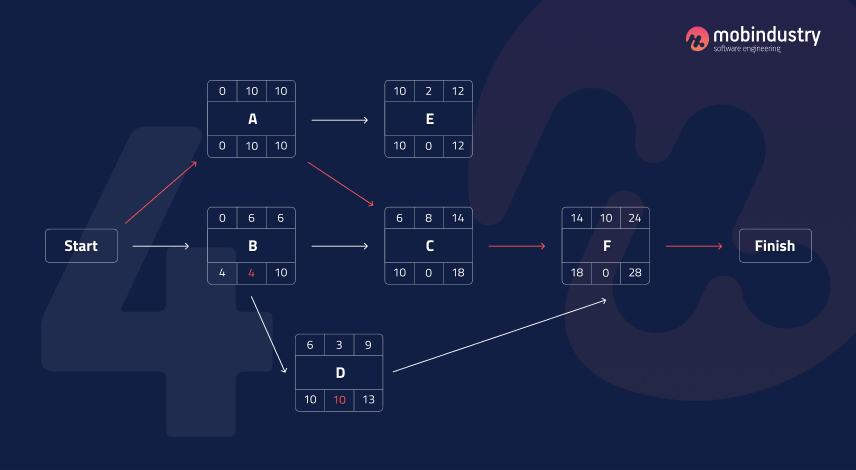
Float indicates how much time is allowed for delaying the task without delaying the delivery of the whole project. If the float is zero, it’s a critical activity and should be prioritized as a part of a critical path.
So, the algorithm looks like this:
- The first task in the sequence starts at 0 and ends at the time of its duration.
- The second task starts at the end of the previous task and ends and its duration plus the time of its start.
Now that you have calculated the start and finish time of each task, calculate the duration of the whole sequence of critical tasks. The longest sequence of critical tasks will be your critical path.
The difference between CPA and other project evaluation methods
At a first glance, a Critical Path Analysis can remind you of other methodologies used by project managers to plan and estimate their projects. Let’s make a quick comparison of CPA and two other popular methods: Program evaluation and review technique (PERT) and a Gantt chart.
CPA vs PERT
Just like CPA, PERT was developed in the 50s to address the issues with project planning. PERT uses optimistic and pessimistic scenarios to evaluate the uncertainty of the project and estimate its delivery date.
The PERT method uses three values to estimate the time range for a project:
- Most likely time estimate (M)
- The optimistic estimate (O)
- The pessimistic estimate (P)
The formula of PERT estimate (E) is this: E = (O + 4M +P) / 6
The main difference between CPA and PERT is the certainty of the timeline. PERT estimate is used to evaluate the time needed to complete the project, while CPM is used when the project is already estimated, and a project manager needs to prioritize the tasks.
Here are the concrete differences between CPA and PERT:
- PERT is used to estimate the projects within an uncertain time frame, while CPA is used with predictable delivery time.
- PERT’s main goal is to make sure the project is completed as soon as possible. CPA on the other hand focuses on compromising between time and costs.
- PERT relies on probability, while CPA determines the outcome.
- PERT uses three estimates for each task, while the CPA method only uses one.
Despite the differences between these two methods, both CPA and PERT analyze these components:
- A list of tasks
- The estimated duration for each task
- Dependencies between the tasks
To make your planning more efficient, you can combine these two methods: for example use PERT to get realistic estimates for the project duration, and then use CPA to find a critical path and calculate your float.
CPA vs Gantt chart
Gantt diagrams or charts are vertical charts that represent the tasks according to a particular chronological order. Both CPA and Gantt charts show the dependencies between the tasks.
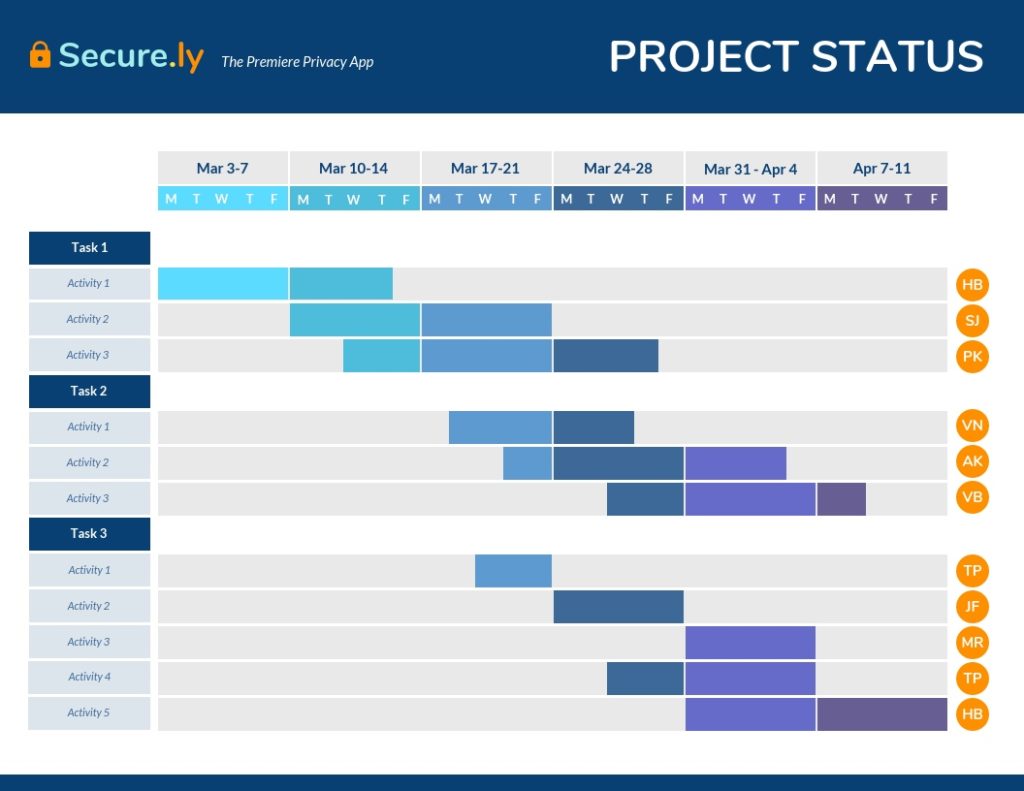
Gantt charts visualize the whole project and show the resources necessary for each task. They use a time scale to show all the tasks and their sequence. Unlike the CPA method, Gantt charts aren’t focused on calculating, estimating, and prioritizing tasks.
Gantt charts show the start and end dates of the project, and also demonstrate which tasks overlap and by how much. Just like CPA, Gantt charts also show the duration of each task, but it doesn’t have any variation that would allow it to calculate float.
You can use Gantt charts along with CPA to track critical tasks and visualize the project flow.
Wrapping up
The critical path method in software project management is one of the best methods in project management that allows you to estimate your project, mitigate the risks, prioritize tasks and allocate resources.
Critical path schedule software can be used with other project management tools and methods to ensure your project is delivered on time without blowing out the budget and resources. This method allows you to find a perfect balance between the time and resources for development.
According to studies, software development projects are even more likely to fail due to poor planning than any other projects, so it’s extremely important to invest in project management, estimation, and planning at the initial stages.
At Mobindustry we use over 10 years of experience in building various software projects, to ensure you get your product on time and on budget. Planning, project estimation, and risk management are one of our first priority tasks in the initial stages of our projects.
If you’d like to create software, or you need skilled project managers for your team, don’t hesitate to contact us: we provide all supporting services for software development projects, from business analysis and management to maintenance and support.

