How to Implement Analytics in Your Mobile App
Mobile app analytics implementation is vital for any app that needs to be stable, functional, and relevant. Learn how you can see and analyze everything happening in your mobile application with the help of mobile analytics.
The world of mobile apps is saturated, competitive, and honestly a bit crazy. According to Statista, there are currently 3.5 million mobile apps on Google Play and 1.6 million apps on the Apple App Store.
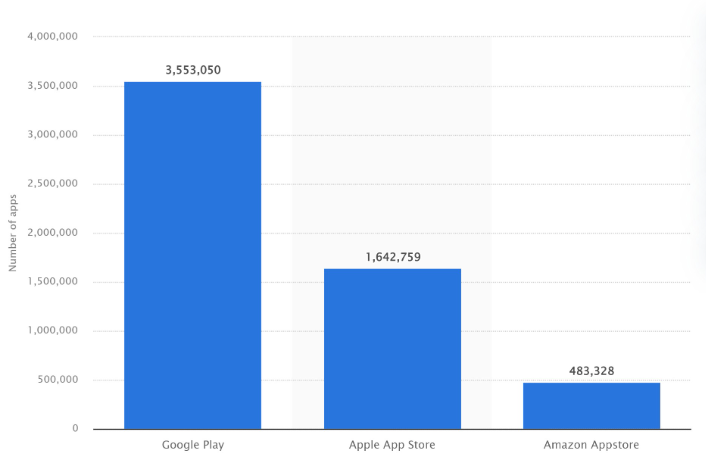
The competition has set certain standards for user experience, and modern users expect flawless performance and usability from their apps. At the same time, businesses are doing everything to get a peek at what their customers are doing in apps, what issues they encounter, and how they can make the user experience smoother.
Mobile analytics is exactly what can help you get this behind-the-scenes view of your users and internal processes happening in your app.
In this article, you’ll learn how how to track mobile app analytics, what metrics matter the most, and how to tackle issues with mobile app analytics integration. We’ll also do a brief mobile analytics comparison, so you can choose a perfect tool set for your product.
What is mobile analytics?
Mobile analytics is special software that gathers and processes data about the users, their devices, and their behavior inside the app. Mobile analytics is capable of identifying unique users based on their data and tracking their engagement, conversion, and user journey.
Mobile analytics doesn’t just collect data: it derives valuable insights and helps businesses optimize their software products based on user behavior
But mobile analytics doesn’t just collect data. It also derives valuable insights and extracts the intent behind certain behaviors it detected. This helps businesses to see the whole picture instead of analyzing countless bits of data on their own as they did previously. Let’s now learn more about the mobile app development process and how mobile analytics influences it.
How does mobile analytics work?
There are different ways in which analytics work. Web analytics uses cookies and JavaScript to identify users, while mobile apps usually have dedicated apps for analytics.
To use them, you need to integrate their SDK (a library) into your app, depending on your platform, and add the initialization code. To track custom events, you’ll also need additional code.
This special piece of software will then assign an identifier to each unique user, and each time they perform an action in your app, the analytics will record real-time data about it and store it on its platform.
These are the data bits that mobile analytics can track:
- App downloads and installs
- App launches
- User location and IP
- Device data
- Operating system and its version
- Log-in/out data
- Unique visitors
- In-app actions and behavior like taps, screens, etc
- Events
- Source of discovery
- In-app purchases
- Conversions
- Sessions
- New and returning users
- Average session time
Thanks to analytics, you can find out:
- Where you get your users from, how they discover your app
- How much time your users spend on your app
- What the most popular features are
- Where the bottlenecks are
- Which features drive conversions and purchases
Analytics also tracks technical information about the app’s performance, like app crashes, issues, load speed, and more, and help in mobile app support and maintenance.
To identify users, dedicated analytics apps generate a permanent unique ID for each device, so they don’t need cookies or other types of identification that are used for website analytics.
Why use mobile app analytics
There are two main interconnected reasons to integrate analytics into your mobile application.
Make data-driven business decisions and boost conversions
Mobile analytics helps you to make more accurate assumptions about the further development of your business and product, so you can achieve a perfect market fit.
This is especially important when you build an MVP and release your app to the public. While your MVP was based on your hypotheses and market research, your fully-fledged product can be based on hard data and real user responses.
There’s really nothing more valuable for business than data; that’s why analytics is vital for success.
Create excellent user experience and build an engaged, loyal audience
Now that you’ve decided on your business strategy, it’s time to go deeper into details and see what your users do with each feature. What do they use most? Where are the bottlenecks on the way to a target action? Analytics can give you answers and allow you to polish your app’s UX.
By collecting data about your audience, you can segment it and personalize their experiences based on demographics, location, previous purchases, and behavior. Personalization turns new users into regular customers and drives up the conversion rate.
We at Mobindustry always advise our clients to set up analytics for mobile apps before the very first release, even if it’s a small MVP, because the data from real users is determinant for the future success of the product.
How exactly do you implement analytics? Let’s find out.
How to implement analytics into your mobile app in 5 steps
Define your mobile app goals
It’s very easy to get lost in loads of data, so you need to keep your focus on a few metrics that really matter.
Do you need to increase your conversion rate, revenue, or engagement? Or maybe you’re just starting and need to get those users coming in? I recommend focusing on 1-3 main goals and choosing your metrics accordingly. We’ll talk about the most popular metrics for app analytics later in the article.
Choose a tool kit
There are lots of tools for mobile app analytics, each with its own twist and set of features. You’ll likely need multiple tools in order to cover both business and technical analytics.
Later in this article, you’ll learn about the most popular mobile analytics tools to choose from.
Integrate your tools into your app
After you’ve chosen your objectives and tools, it’s time to integrate and set up your mobile app analytics. For this, you’ll need a mobile developer, an SDK of your chosen tools, and some time.
Most analytics software products are rather easy to integrate and use. A typical process consists of these steps:
- Create an app and get an API key
- Install the SDK
- Initialize the app analytics tool
- Set up the available features
As you can see, the process is quite straightforward. Flurry analytics, for example, takes no more than 5 minutes to integrate the out-of-the-box metrics. If you need something more specific and tailored to your unique app, you want to set up custom events.
Set up custom events
If you want to know more about a specific aspect of your app or do A/B testing, you need to set up custom events. This requires additional code, and allows you to track any specific actions users take in your app, for example, in-app purchases, articles read, posted comments, completed levels, etc.
Analyze your data
This is the most important step. Now that you’ve collected your data, you need to interpret it correctly and derive the right conclusions from it. Make hypotheses and experiment until you reach the best solution for your users and for your business.
Top mobile app analytics tools
Firebase
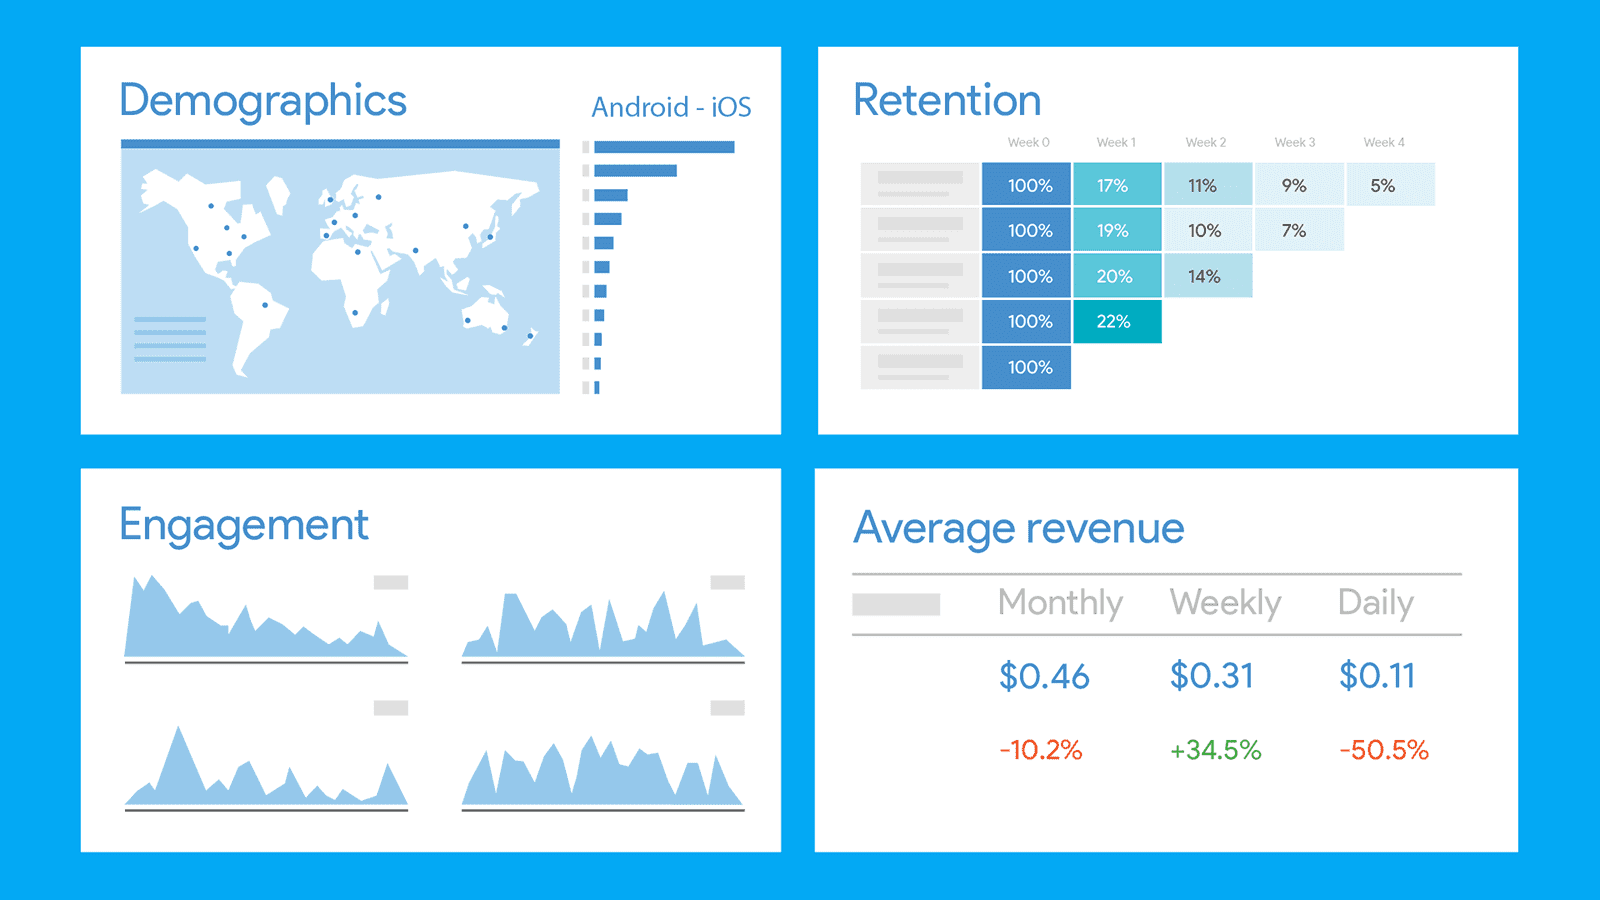
Firebase is a large platform for app building, testing, releasing, and monitoring. It also has multiple analytics tools for mobile applications. Google Analytics for mobile apps and Crashlytics are among the most popular.
Google Analytics provides a wide range of tools and functionality that can show you who uses your app, their demographics, how they discover your app and more. GA is one of the most powerful tools for marketers, as it allows you to split your audience into segments and view how well your marketing campaigns performed.
Crashlytics, on the other hand, is an analytics tool that helps developers detect technical issues. It’s a flagship Firebase service for crash reporting that allows you to see the timeline of all events that were leading up to the crash, so you can quickly find the cause and fix the bug quickly.
Tracking the app’s performance in Crashlytics is a part of Mobindustry’s mobile app maintenance services.
Mixpanel
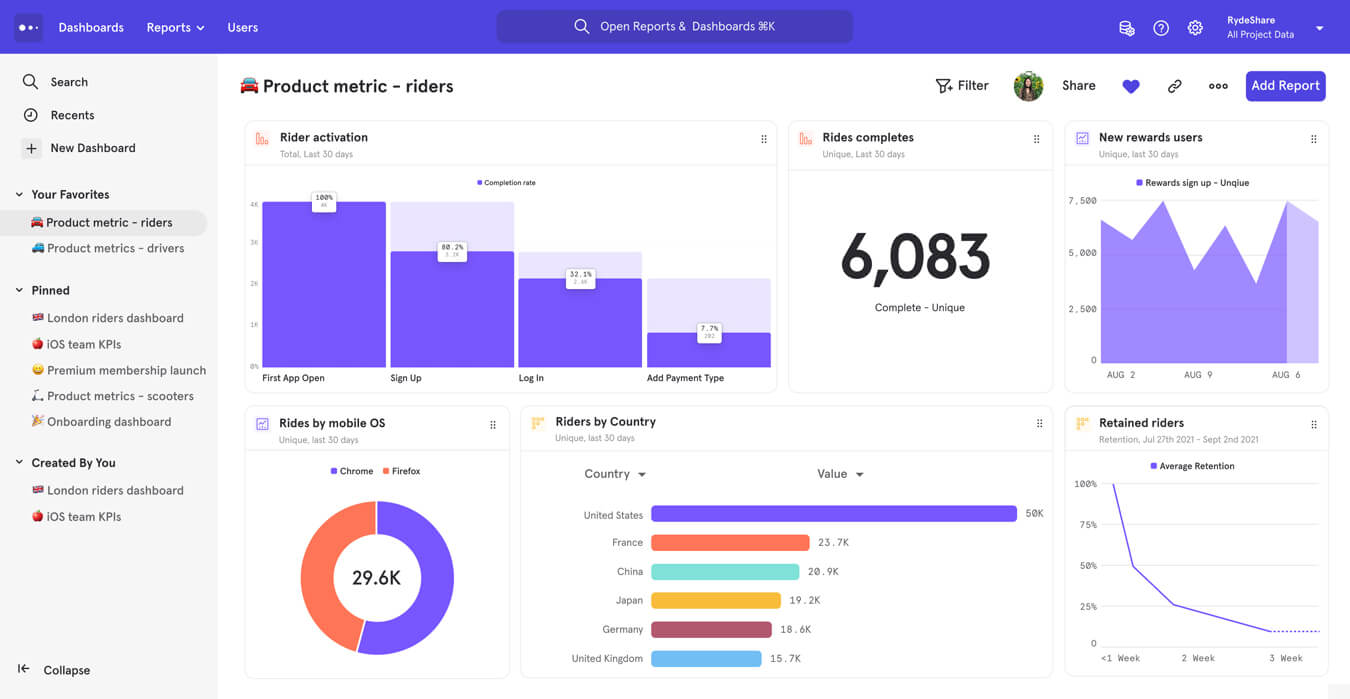
This is a popular mobile application analytics tool that’s focused on engagement, user behavior, and interactions. Mixpanel has a convenient dashboard with visual data presentation. Its core reports include:
- Insights
- Funnels
- Flows
- Retention
Localytics
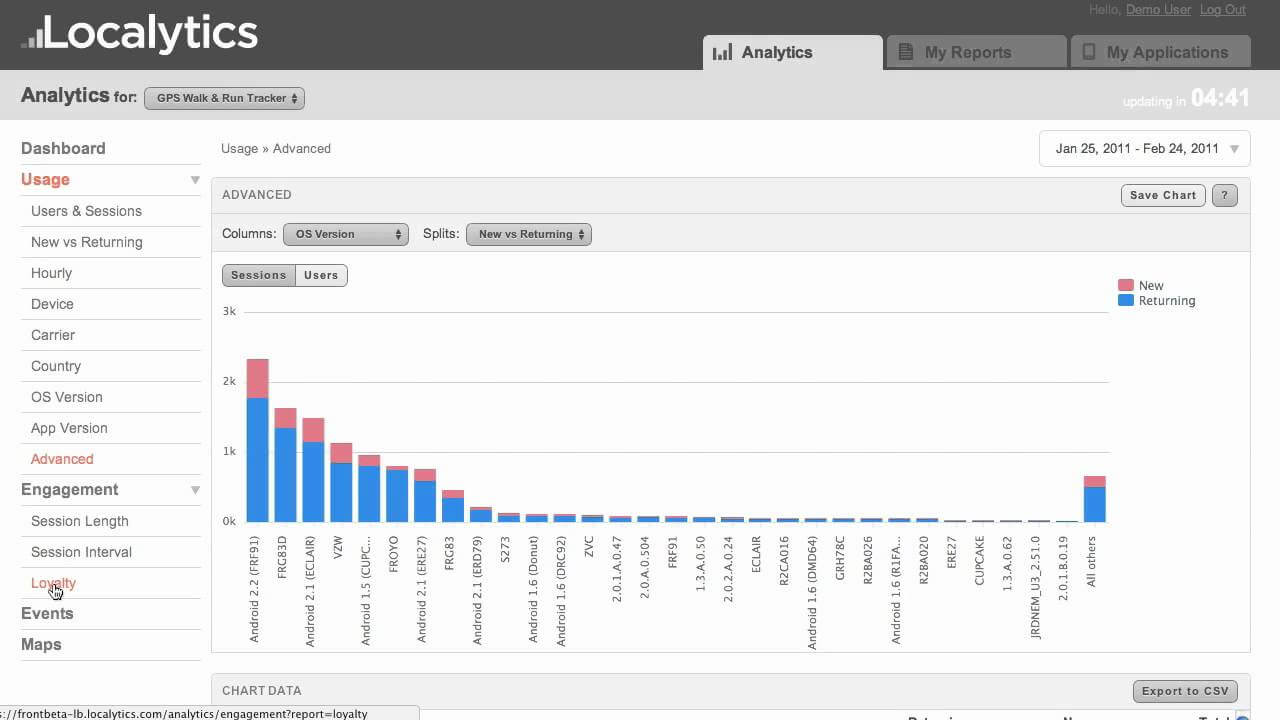
Localytics is an extremely popular tool used by large companies like MyFitnessPal, Salesforce, and Microsoft. It’s most famous for its marketing abilities: by deeply analyzing your audience, Localytics can facilitate the most personalized ad and notification campaigns.
Localytics also tracks user behavior and preferences, helps to analyze funnels, and experiments with UX and marketing campaigns until you reach the best results.
Flurry
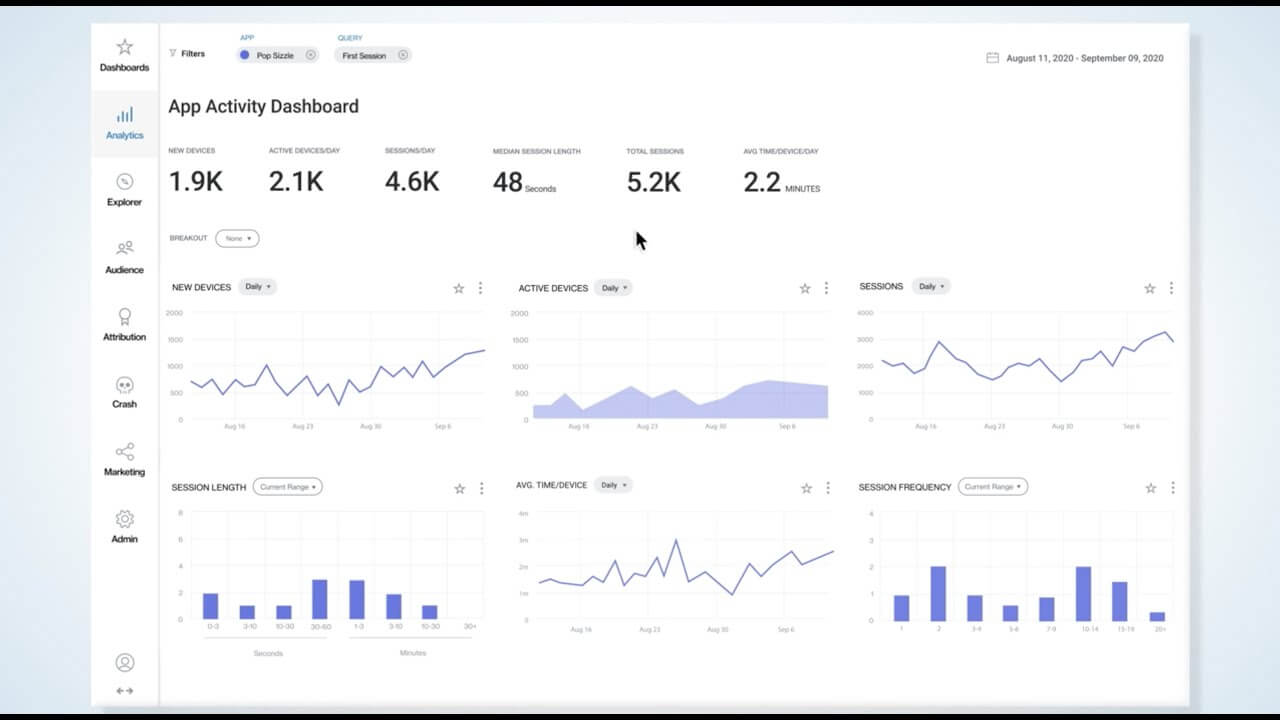
Flurry is by far the most popular (and free!) mobile app analytics tool on the market. Today, over 250,000 companies use Flurry to track 2 billion applications all over the world. Among their high-profile users are Samsung, Ubisoft, Warner Brothers, and CBS Interactive.
Flurry provides a full range of analytics services and allows businesses to track:
- Audience
- Events
- Funnels
- User journeys
- Segments
- Retention
- Acquisition
- Attribution
- Conversion
Your toolset will depend on your goals and budget. Most companies use 2-3 analytics tools, one for audience tracking and the other for technical issue detection.
At Mobindustry, we usually use Firebase, which covers both these aspects and has infinite possibilities for user behavior and performance tracking.
Most important metrics in your mobile analytics
No matter what mobile app analytics tools you choose, they need to have certain features important for effective data tracking and analysis. Let’s talk about the most important, basic metrics you need to pay attention to track your app’s marketing performance.
App downloads
This metric is especially important at the beginning of your app journey. You’ve just released your application and are now actively acquiring users through different marketing and advertising channels.
The app download metric can show you whether you:
- Target the right audience
- Run effective ad and marketing campaigns
- Have the right message
If you see that few people download and install your application, you either haven’t communicated your value clearly enough, or you’re tapping into the wrong audience, and the right people haven’t seen you yet.
Active users
When you look at active users, you can see how many people are actually using your application after installing it. The low number of active users can tell you that users don’t engage with an app enough and don’t return after the first visit.
Your number of active users should grow progressively, along with the number of downloads.
Average session time
This is also a critical engagement metric that shows how well your app captures user attention. Along with the session time, you should also check the average number of screens a user opens during one session. If they stop at the first screen, this means they aren’t engaged enough.
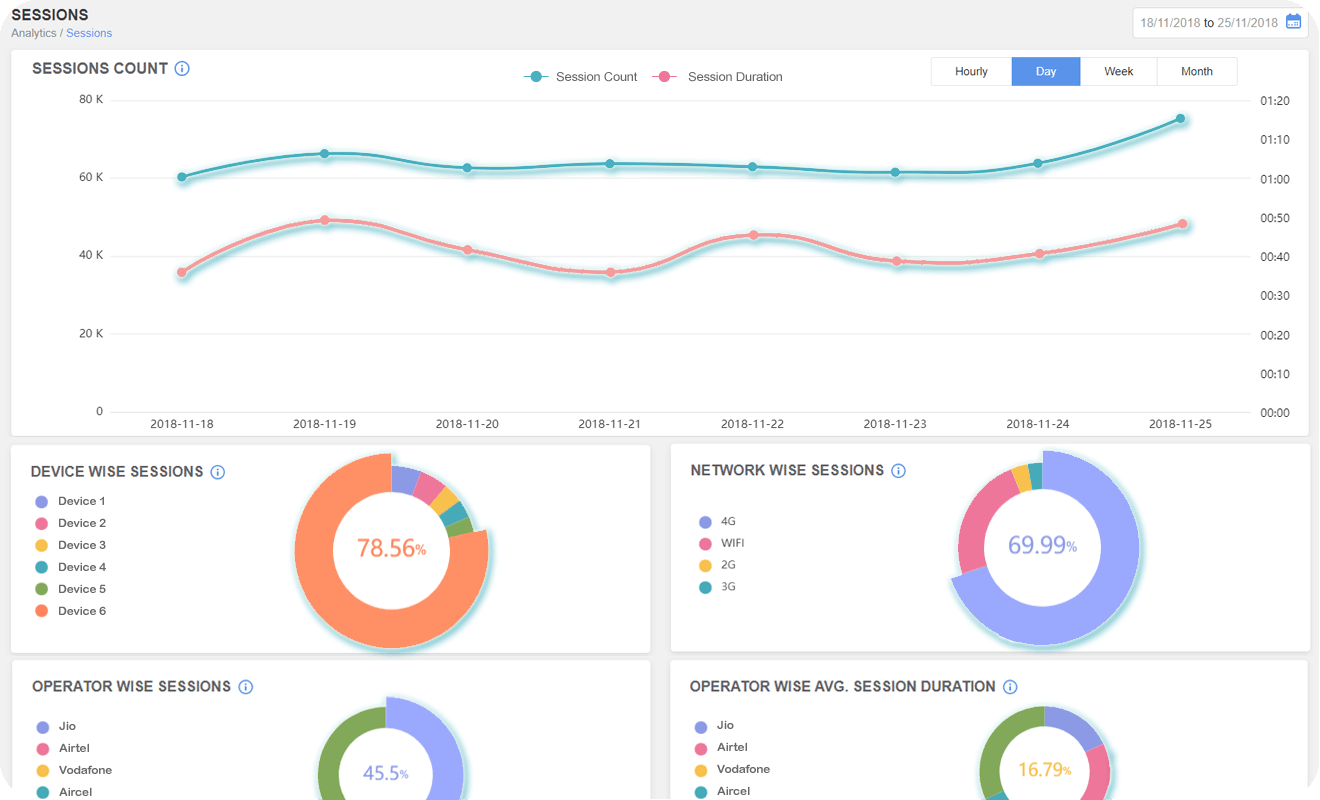
For some types of apps, the average session duration is more important than for others. For example, a social media platform like TikTok will clearly value this metric more than an e-commerce store that cares first and foremost about conversions and revenue.
Conversion rate
This metric shows you the number of users who performed a target action in your application. For a telemedicine app, this is a scheduled appointment; for an ecommerce app, the conversion is going through with a purchase.
You should see your conversions in a context and view the steps users took leading up to it.
You can also track micro conversions: checkpoint actions that lead up to a conversion. In an ecommerce app, micro-conversions are, for example, using a search bar, checking the reviews, and adding a product to the cart.
User acquisition and LTV
This metric show how much money you spend on getting a new user. The expenses may be related to ads, marketing campaigns, PR, customer support, and other activities. You can also calculate the Life Time Value (LTV). Ideally, your user acquisition cost should be lower than their LTV.
Retention rate
This shows how many users see enough value in your app to return after the first visit. A retention rate is very important for all mobile applications because it’s not enough to bring new users to the platform: you also need to know how to keep them and turn them into regular users.
If your retention rate suddenly drops, there may be different reasons, including technical ones. For example, if you’ve recently updated your app or did a redesign, your users may have experienced crashes or been confused. Make sure to gather feedback and fix everything that may have turned your users away.
Churn
This is the opposite of the retention rate and shows how many people stop using your application over time. The more time passes, the higher your churn is. Some users abandon apps after the first launch, others stop using them later down the line.
According to Statista, 57% of users churn in the first month. After three months, the churn rate reaches 71%.
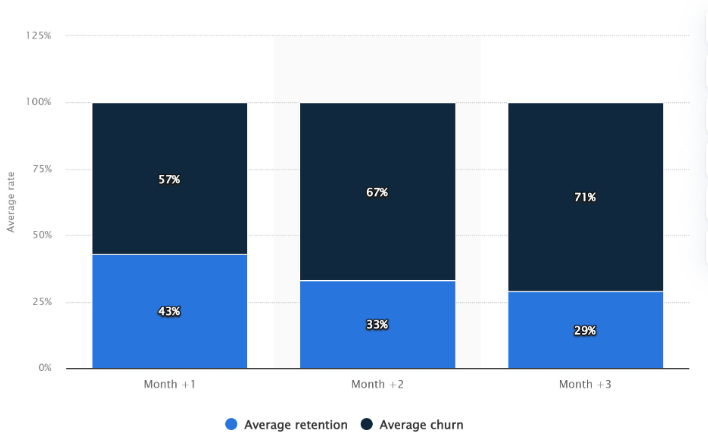
Additionally, you can also track the uninstall rate and compare it with the number of downloads within a certain period of time, like day, week, or month. If both metrics are almost equal, or the number of uninstalls exceeds the number of downloads, you should start looking for a cause.
Often, the reason for a high uninstall rate is technical: look for crashes, bugs, or performance issues.
Cohort analysis
Cohorts are groups of people with similar characteristics and behaviors. Cohort analysis allows you to see the metrics like retention, churn, engagement, and so on for different groups of users.
You can use this information to make their experience more individualized and thus increase conversion and retention rates.
How to avoid common mobile analytics mistakes
Make sure you interpret data correctly
Analytics is only a tool that helps you capture and clearly present data, but it’s your responsibility to interpret it and make the right decisions. Many cognitive biases can hamper the decision-making process.
Acknowledging biases is the first step to success. Then, you need to be wary of them when you derive conclusions about your user behavior and reasons for it.
In order to avoid misinterpreting data, ensure you treat ideas within your organization equally, no matter who presents them. For this, you can get your team members to submit ideas anonymously.
Track data across all platforms
Most often, businesses have both web and mobile presence. Some others also have an offline dimension like a brick-and-mortar store.
Your goal is to track user data across all your platforms. Otherwise, you won’t get the full picture. Make sure the tool you get is truly omnichannel and can present you with data from all sources. Even if you have a brick-and-mortar store, there are ways to connect it with your mobile platform through loyalty programs and special mobile promos.
Choose your analytics platform wisely
Data is the new gold, so there are tons of analytics and customer engagement platforms on the market for both iOS and Android apps. Their offers are similar, but once you start digging deeper, you start seeing the crucial differences.
Before you commit and subscribe to a service, make sure it can be integrated with all your products on all platforms and that their pricing allows you to get access to more data as you grow without blowing up your budget.
If you’re not sure what analytics service is best for you, contact us. We’ve tested many different services over the years in dozens of various projects, so we’ll be able to pick a perfect vendor for your specific needs.
Final thoughts
Running a mobile app business without analytics is like searching for something in complete darkness. Analytics provides priceless insight into your user behavior, expectations, and preferences. This is better and more accurate than any surveys you can take because it shows what exactly your users do.
However, there’s another side to using analytics: it’s easy to get overwhelmed with data and find it challenging to make decisions. For your analytics to be effective, you need to define goals and decide which metrics matter to you most.
We at Mobindustry not only integrate analytics into our clients’ products but also help them analyze and interpret data correctly. We also provide recommendations on user experience based on user behavior.
Tracking technical performance through tools like Crashlytics is the standard activity that helps us quickly identify and fix any issues.
If you have any questions about integrating analytics into your mobile app, or you’re struggling to pick the right toolset, don’t hesitate to contact us. With Mobindustry, you can be sure that you’ll never be lost in information, and your data-driven decisions will help you meet your business goals.

